ManagedAnalytics has its deepest roots in mining. Helm models the mine-to-port value chain - pit, haul, mill, plant, stockpile, rail and port - as a single digital twin, then lets AI reason across the whole system. Every question, from a supervisor's mid-shift call to a board capital decision, is answered against the operating reality of the business.
Helm now renders the twin as a full 3D simulation of the operation - underground workings and open-cast pits, drive by drive, bench by bench. Every machine is tracked, every delay sits on the timeline. Replay any shift, see exactly where plan and reality diverge - then ask the AI Analyst why.
The underground twin renders development and stoping level by level, then replays the month event by event - so "where are we against plan?" has a picture, not just a number.
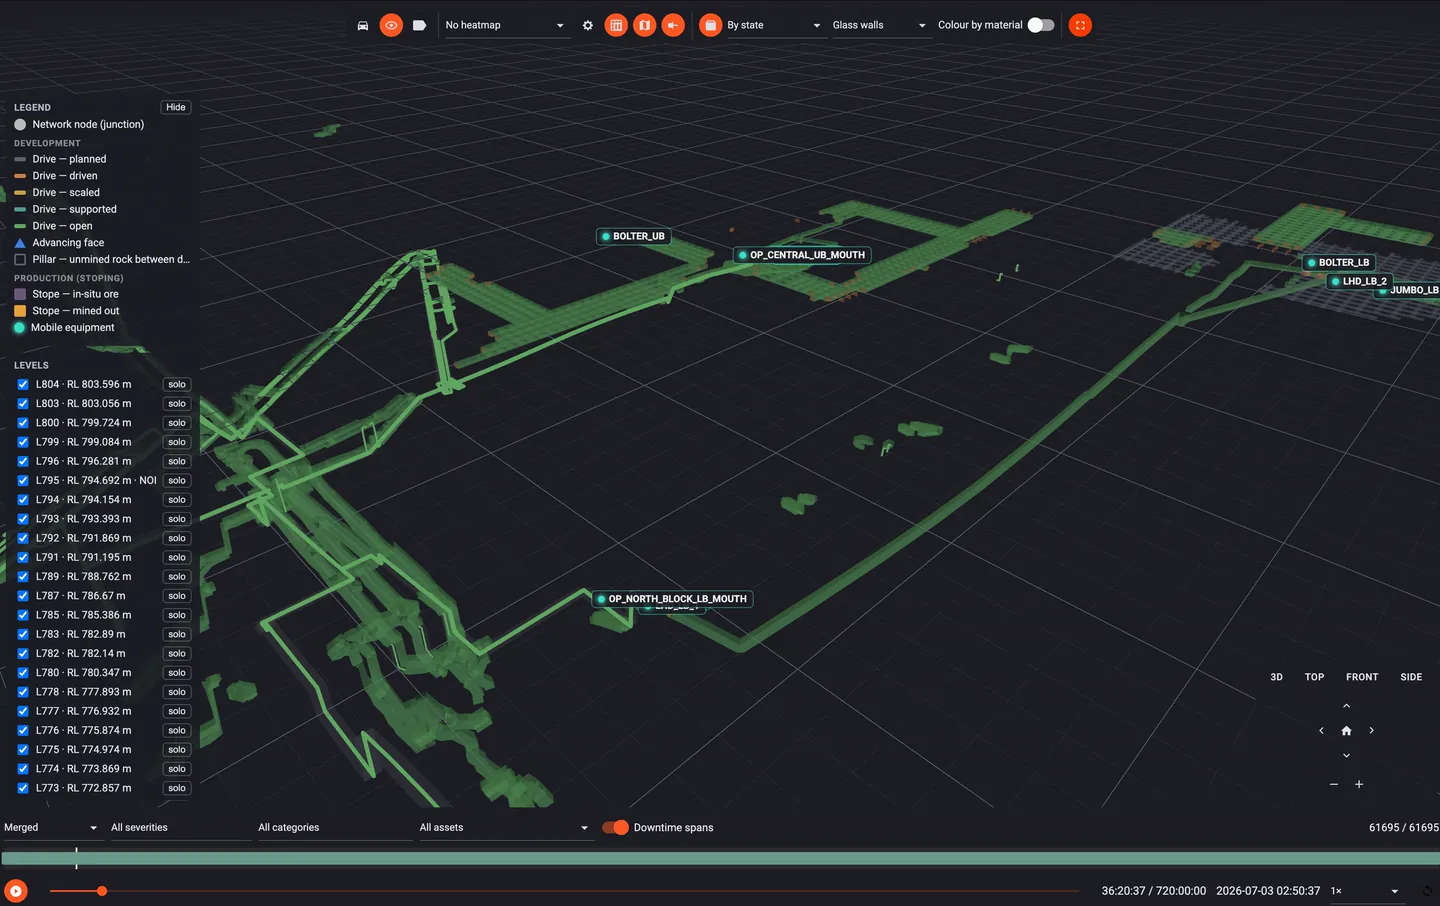
Two renders of the same underground twin — switch Network / Development detail in the viewer bar above.
The open-cast twin drapes the haul network over the actual pit and plays the shift back truck by truck - every cycle, every queue, every delay, exactly where it happened.
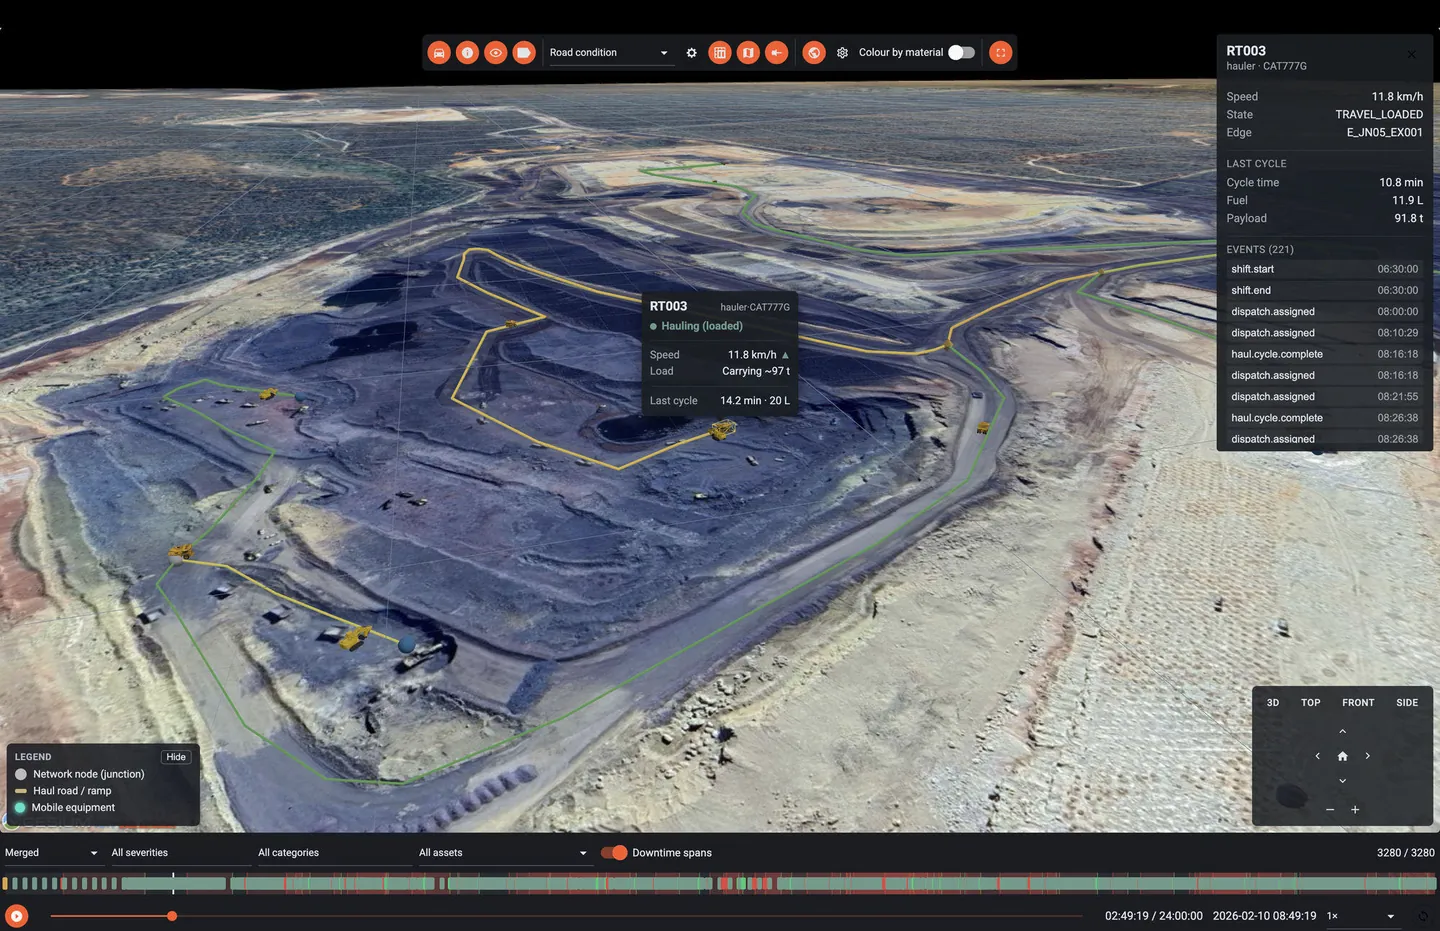
Most mining analytics stop at a dashboard built on a copy of the data. Helm goes a layer deeper. It builds a digital twin that integrates operational parameters, the cost and revenue structure, distribution and logistics, and the organisation itself - so a number on a screen is always connected to the asset, the constraint and the business logic that produced it. The 3D replay, the dashboards, the simulation and the AI Analyst all read this one twin - so what you watch in replay is the same truth the variance analysis later explains.
Geology, drill & blast
Excavators, trucks, routes
Crushing, screening, DMS
Blend & buffer
Inland logistics
Ship & sell
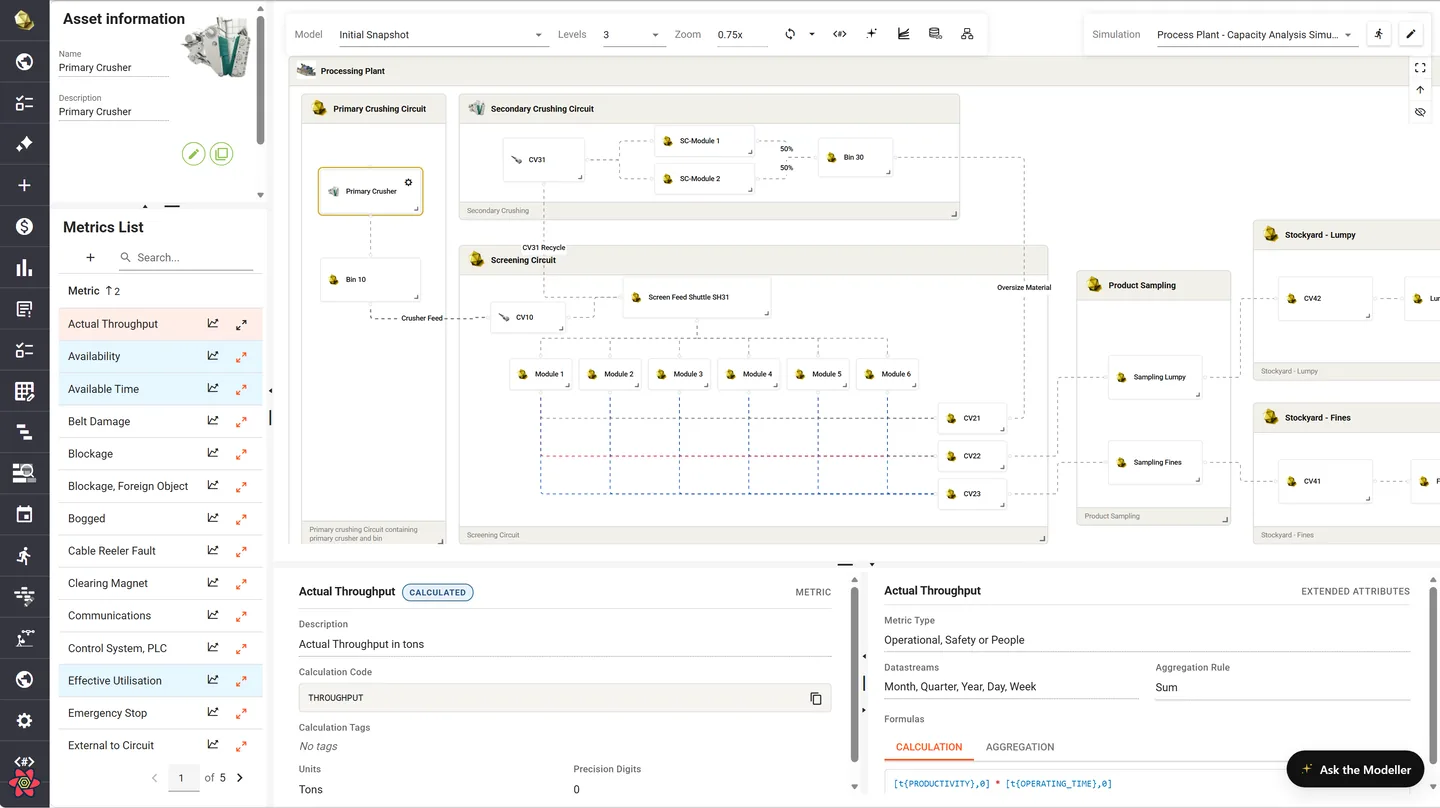
Plant and equipment are configured from a shared template library, so a new model or scenario takes hours, not weeks - and every entity carries a rich set of operating, reliability and cost metrics, ready for analysis the moment data lands.
Mining runs on a cadence: forecast, plan, implement, review, report. Helm threads the same model through all of it, so the shift supervisor and the CFO work from one version of the truth - just at the level of detail each one needs.
| Horizon | Who is deciding | What Helm puts in front of them |
|---|---|---|
| Shiftlive | Supervisor · operators | Live shift dashboard - fleet utilisation vs target, ranked delay events, drill-pattern and crusher-feed conformance, and an end-of-shift handover that writes itself. |
| Day24h | GM · heads of department | GM daily standup - performance vs 24-hour target, safety, the 7-day rolling plan and a delay timeline that splits planned from unplanned downtime. |
| Weekshort-interval | Planning · section leads | Short-interval control - the 2-week schedule, the constraint and bottleneck view, and variance-to-schedule that routes major deviations for approval. |
| MonthMBR | ExCo · divisional GMs | Monthly business review - production and cost variance vs budget, value-driver decomposition, and a board-ready pack drafted from the live operation. |
| Quarter / Yearstrategy | Board · CFO · CEO | Budget and strategy scenarios - commodity-price, FX and cost sensitivities, capital allocation across the portfolio, and life-of-asset volumes. |
The most frequent decisions in mining are made on the shift - and too often on gut feel, because the data arrives too late to matter. Helm pushes live, role-ready views to the frontline - fleet time usage split planned vs unplanned, ranked delay events, truck cycles and live stockpile buffer - drawn straight from on-board telematics on CAT and Bell equipment or the dispatch system. The end-of-shift handover writes itself as the shift runs.
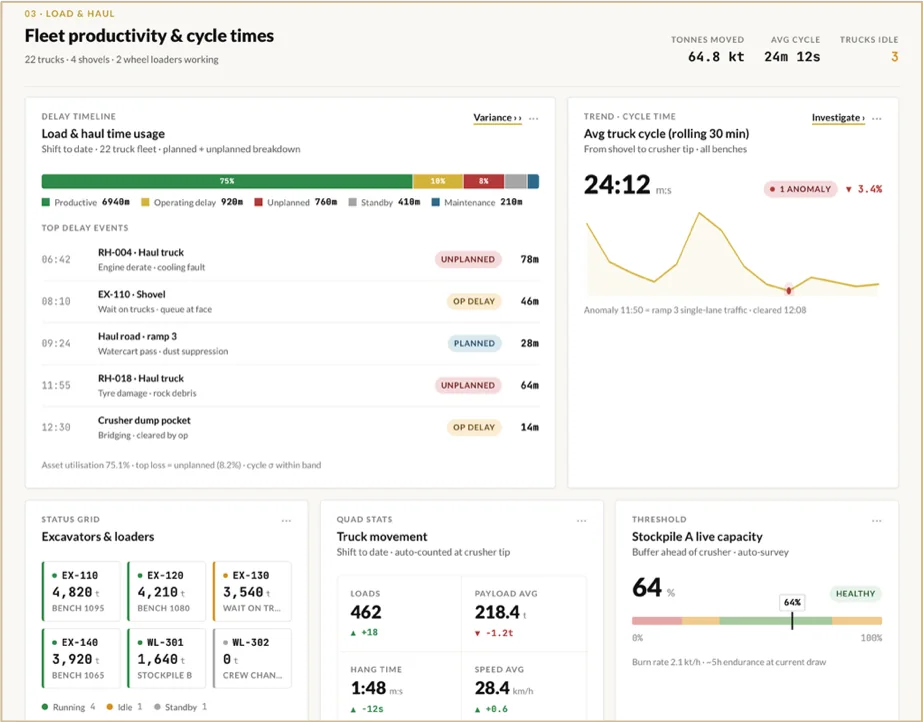
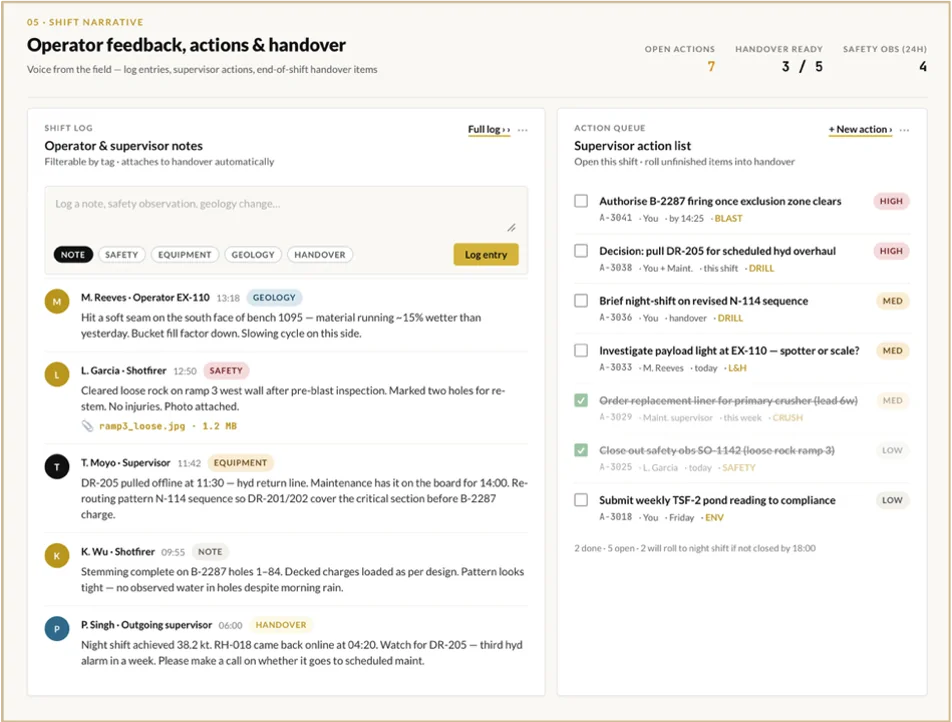
Two shift views - fleet productivity & cycle times, and operator feedback, actions & a handover that writes itself.
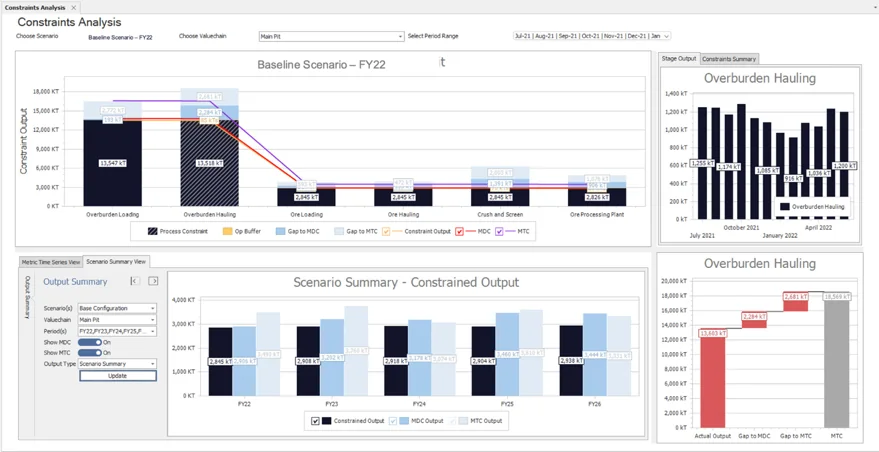
A daily plan that ignores queuing, breakdowns and blend constraints is a wish-list. Helm's built-in discrete-event simulation engine reproduces the mining cycle event by event, so optimisation teams can see exactly where time and efficiency are lost - and test the fix before committing the next short-interval plan.
Theory-of-Constraints logic across the chain shows constrained output at every stage - loading, hauling, crush, process - where the system bottleneck sits today and what is starving downstream, and how it shifts as fleet and mine configuration change across multiple FY horizons.
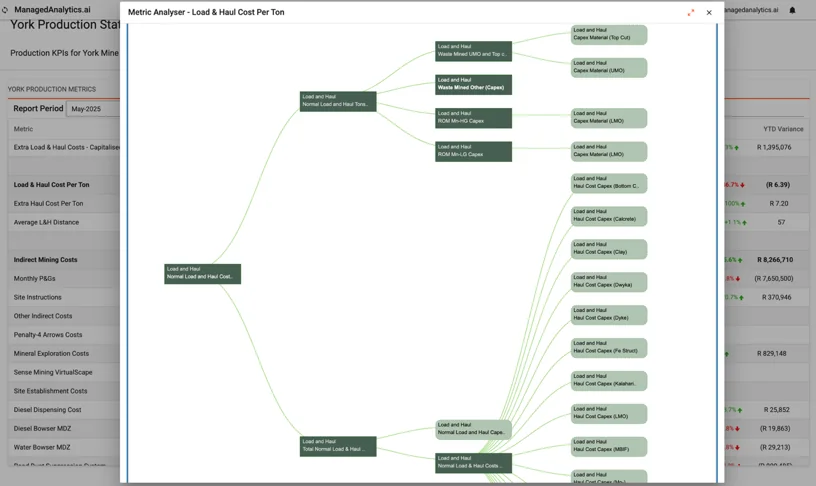
"Costs are up" is not a decision. "Diesel dispensing and monthly P&Gs drove load-and-haul cost per tonne up, and here is the value-driver tree behind it" is. Helm decomposes every financial result through the twin's business logic, so cost management starts from cause - not from a number in red.
Value-driver trees are generated automatically for any metric - cost per tonne, EBIT, recovery, anything modelled - straight from the underlying business logic, with single-click variance-vs-budget waterfalls that rank favourable and adverse effects, and full lineage from the headline number back to source data. The "why" is always one click from the "what".
Helm's AI Analyst performs ad-hoc 'what-if' and variance analysis across the entire operation. Ask a question, or brief it like an analyst - because it reasons over the twin, not a static extract, it chains retrieval, calculation, simulation and charting into a single answer, with provenance on every figure. Sessions are shareable in real time, so a planning team can investigate a variance together, live.
Helm starts with a core analytics platform and adds capability as plug-in modules - each sharing the same twin and business logic, so nothing is rebuilt and everything stays consistent: Core Analytics, Operational Decision Support, Simulation & Advanced Analytics, Business Optimisation, Distribution Optimisation and Decarbonisation →
Variance explanation across operations and processing, constraint & bottleneck modelling pit to port, discrete-event simulation of proposed changes, value-driver analysis tied to commodity-price and cost scenarios, capital allocation across asset portfolios, and board & ExCo packs generated from the live operation - each at the right altitude for the GM, the COO and the CEO.
Composite outcomes drawn from real deployments — and the words of a CFO who ran a budget cycle in the twin. Customer-specific stories are shared under NDA in a briefing.
In our first budget cycle we ran multiple driver-based scenarios in the twin. The quality of our budget packs and analysis was transformed, and we had full traceability to source data whenever we needed to drill into a number.
CHIEF FINANCIAL OFFICER · TIER-1 MINER
A briefing typically takes 60 minutes. We will show the platform applied to a business that looks like yours - same value chain, similar reporting cadence, real numbers redacted as needed. From engagement, the first executive use case is in production by week 8.
