ManagedAnalytics has its deepest roots in mining. Helm models the mine-to-port value chain - pit, haul, mill, plant, stockpile, rail and port - as a single digital twin, then lets AI reason across the whole system. Every question, from a supervisor's mid-shift call to a board capital decision, is answered against the operating reality of the business.
Most mining analytics stop at a dashboard built on a copy of the data. Helm goes a layer deeper. It builds a digital twin that integrates operational parameters, the cost and revenue structure, distribution and logistics, and the organisation itself - so a number on a screen is always connected to the asset, the constraint and the business logic that produced it.
Geology, drill & blast
Excavators, trucks, routes
Crushing, screening, DMS
Blend & buffer
Inland logistics
Ship & sell
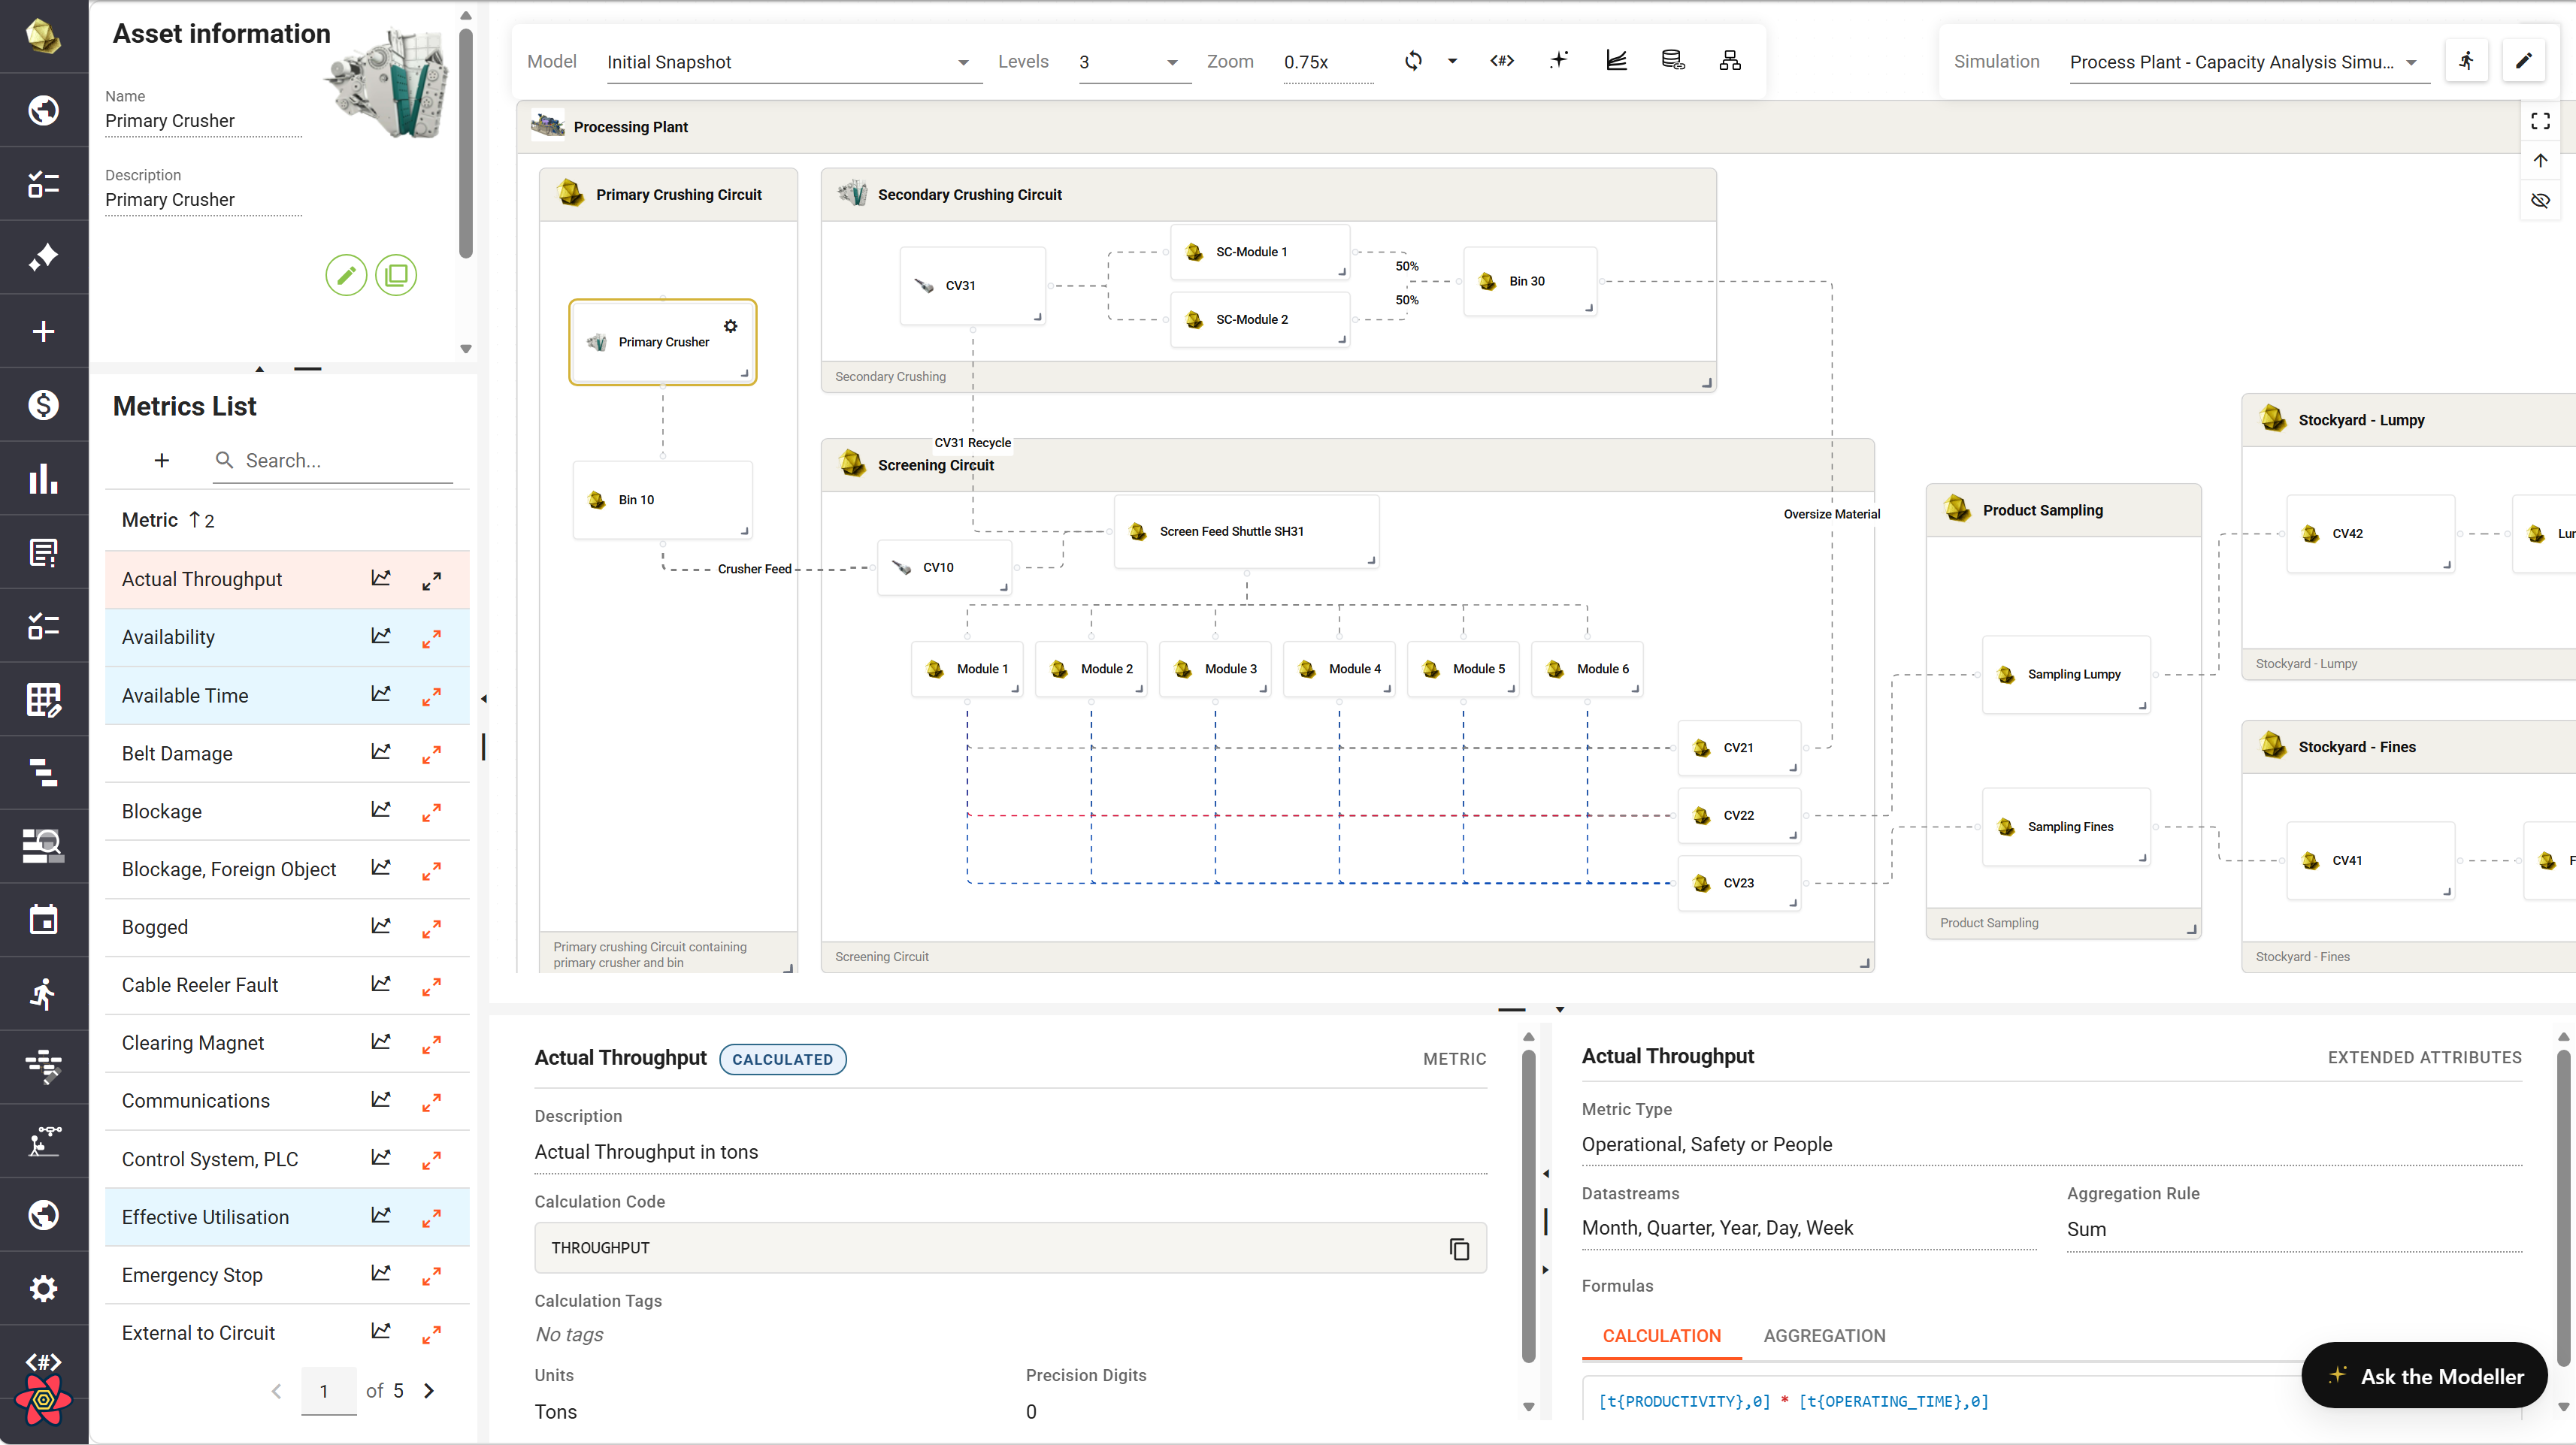
Plant and equipment are configured from a shared template library, so a new model or scenario takes hours, not weeks - and every entity carries a rich set of operating, reliability and cost metrics, ready for analysis the moment data lands.
Mining runs on a cadence: forecast, plan, implement, review, report. Helm threads the same model through all of it, so the shift supervisor and the CFO work from one version of the truth - just at the level of detail each one needs.
| Horizon | Who is deciding | What Helm puts in front of them |
|---|---|---|
| Shiftlive | Supervisor · operators | Live shift dashboard - fleet utilisation vs target, ranked delay events, drill-pattern and crusher-feed conformance, and an end-of-shift handover that writes itself. |
| Day24h | GM · heads of department | GM daily standup - performance vs 24-hour target, safety, the 7-day rolling plan and a delay timeline that splits planned from unplanned downtime. |
| Weekshort-interval | Planning · section leads | Short-interval control - the 2-week schedule, the constraint and bottleneck view, and variance-to-schedule that routes major deviations for approval. |
| MonthMBR | ExCo · divisional GMs | Monthly business review - production and cost variance vs budget, value-driver decomposition, and a board-ready pack drafted from the live operation. |
| Quarter / Yearstrategy | Board · CFO · CEO | Budget and strategy scenarios - commodity-price, FX and cost sensitivities, capital allocation across the portfolio, and life-of-asset volumes. |
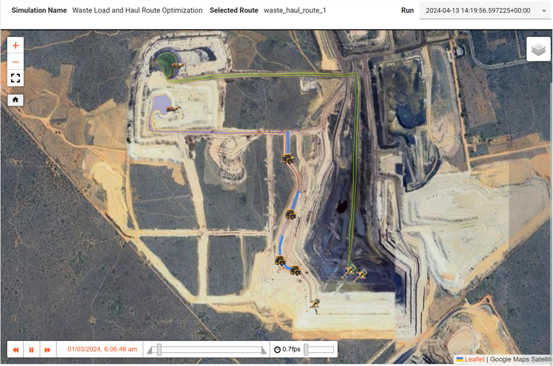
The most frequent decisions in mining are made on the shift - and too often on gut feel, because the data arrives too late to matter. Helm pushes live, specific, role-ready views to the frontline, drawn straight from on-board telematics on CAT and Bell equipment or from the dispatch system.
Supervisors stop reconstructing the shift from memory and radio calls. The picture is already assembled - and the handover is built as the shift runs.
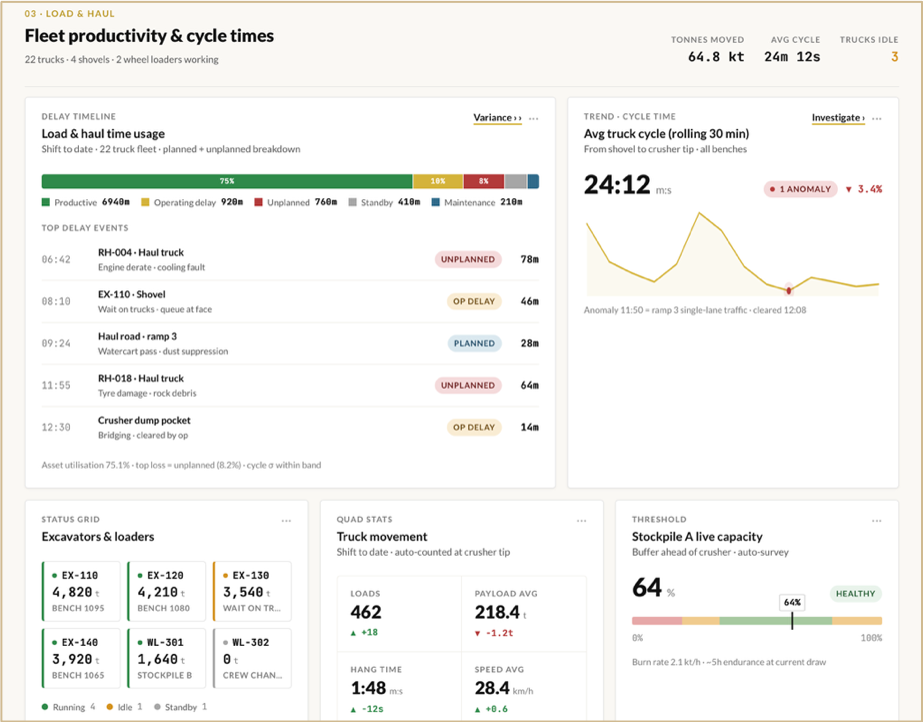
The same data the shift acted on becomes the monthly production story - no spreadsheet rebuild between the pit and the GM's standup.
A daily plan that ignores queuing, breakdowns and blend constraints is a wish-list. Helm's built-in discrete-event simulation engine reproduces the mining cycle event by event, so optimisation teams can see exactly where time and efficiency are lost - and test the fix before committing the next short-interval plan.
Discrete-event simulation over the real haul network turns "the trucks felt slow" into a quantified, addressable loss.
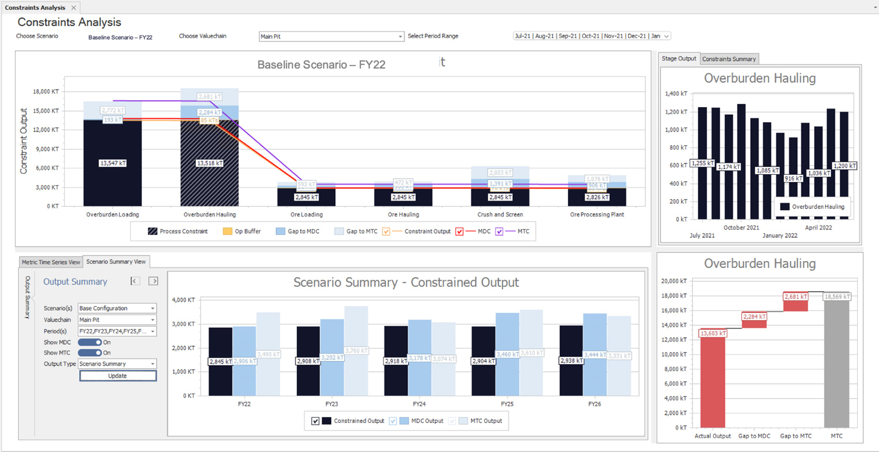
Theory-of-Constraints logic, applied across the chain, shows where the bottleneck sits today and how it shifts as the operation changes.
"Costs are up" is not a decision. "Diesel dispensing and monthly P&Gs drove load-and-haul cost per tonne up, and here is the value-driver tree behind it" is. Helm decomposes every financial result through the twin's business logic, so cost management starts from cause - not from a number in red.
Value-driver trees are generated automatically for any metric, straight from the underlying business logic - so the "why" is always one click from the "what".
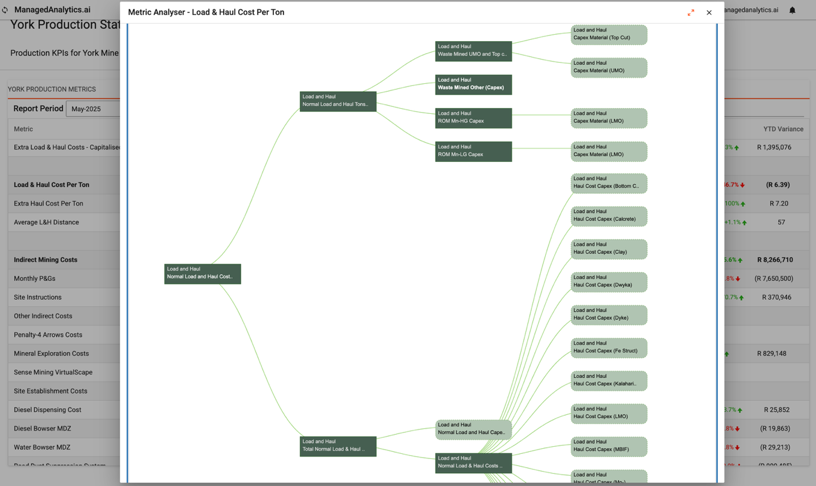
Because drivers are wired into the twin, Helm can sweep them and show the impact on the bottom line - with fair attribution even when drivers interact.
Helm's AI Analyst performs ad-hoc 'what-if' and variance analysis across the entire operation. Because it reasons over the twin - not a static extract - it chains retrieval, calculation, simulation and charting into a single answer, with provenance on every figure. Sessions are shareable in real time, so a planning team can investigate a variance together, live.
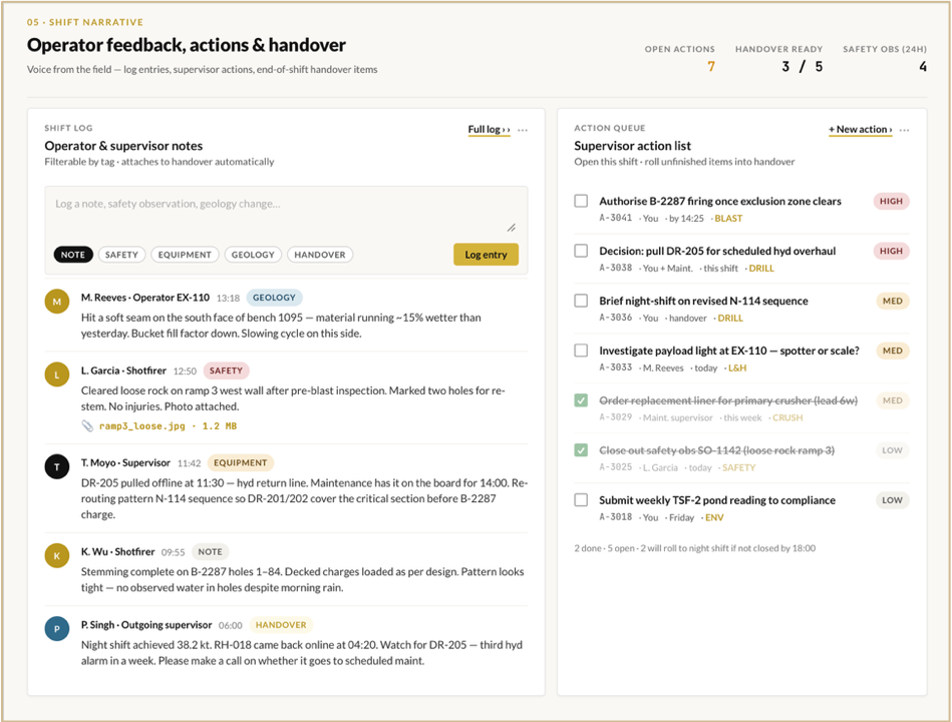
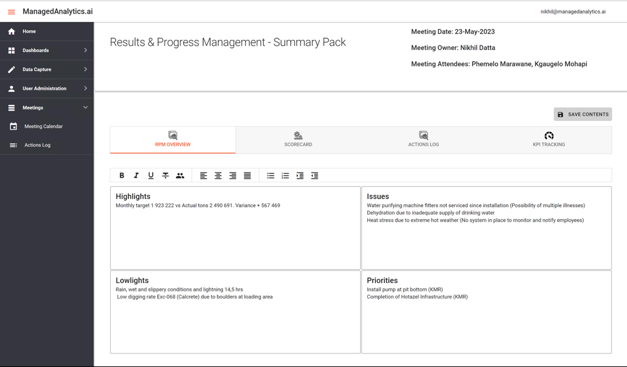
An insight that does not change what happens on the ground is overhead. Helm closes the loop: structured meetings, scorecards and an initiative portfolio that all draw directly from the platform - no re-importing, no parallel spreadsheets.
The Results & Progress Management cadence keeps the discussion anchored to the numbers - and every decision leaves with an owner.
The same model tracks diesel and power emissions and generates MACC curves - so abatement sits alongside cost and production in the same decision, not in a separate sustainability silo.
Helm starts with a core analytics platform and adds capability as plug-in modules. Each one shares the same data and business logic, so nothing is rebuilt and everything stays consistent.
| Module | What it adds |
|---|---|
| Core Analytics | Time-series, variance, value-driver and sensitivity analysis, plus Pareto charts - on every metric in the twin. |
| Operational Decision Support | User and team KPI dashboards, individual and asset scorecards, meeting management and action tracking. |
| Simulation & Advanced Analytics | Discrete-event simulation, constraint and capacity modelling, goal-seek, and the ability to build and train ML models. |
| Business Optimisation | Opportunity logging, initiative prioritisation, end-to-end project and portfolio management, custom pipeline reporting. |
| Distribution Optimisation | Multi-mode distribution channels, least-cost routing, and product, route, warehouse and port constraints. |
| Decarbonisation | Diesel and power emissions tracking, and MACC curves to support abatement decisions alongside cost and production. |
At the right level for the GM, the COO and the CEO.
See the use caseAcross the value chain - pit to port.
Tied to commodity-price and cost scenarios.
Across asset portfolios and growth options.
See the use caseIn our first budget cycle we ran multiple driver-based scenarios in the twin. The quality of our budget packs and analysis was transformed, and we had full traceability to source data whenever we needed to drill into a number.
- CHIEF FINANCIAL OFFICER, TIER-1 MINER
A briefing typically takes 60 minutes. We will show the platform applied to a business that looks like yours - same value chain, similar reporting cadence, real numbers redacted as needed.