
What is ManagedAnalytics?
ManagedAnalytics is a cloud-based platform designed to transform how asset-intensive businesses, particularly in the mining sector, interact with their operational data. By constructing a hierarchical digital model of your mine, the platform integrates analytics, optimisation, and decision support capabilities to enhance asset utilisation, workforce productivity, and capital allocation.
Digital Twin Technology
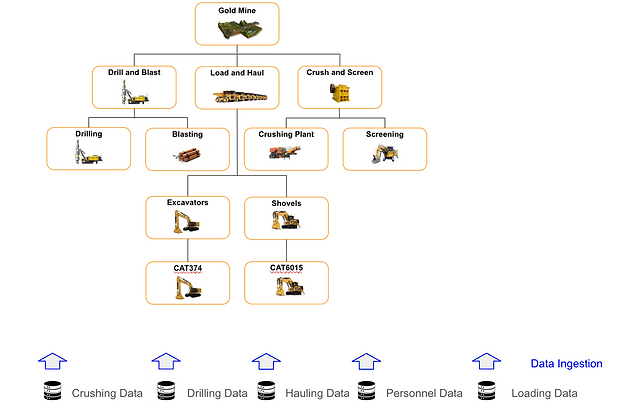
At the core of ManagedAnalytics is its digital twin technology, which creates an intelligent, hierarchical representation of your mine's value chain.
Utilising a drag-and-drop interface, users can select items from a global object library or model new ones using an advanced object modeller. This allows for the customisation of each operating entity to reflect real-world behaviours, enabling rapid development of models and scenarios.
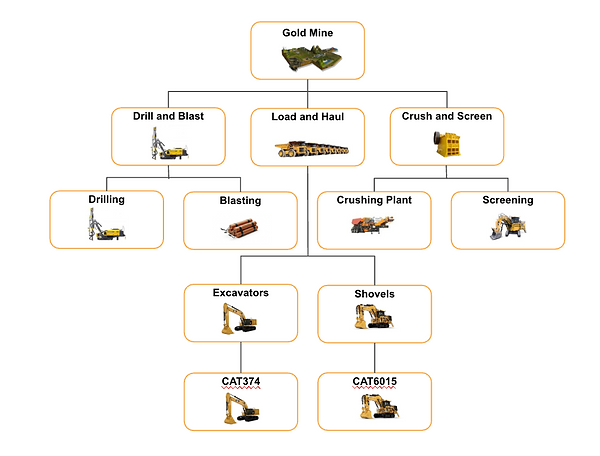
Plant and equipment templates are shared via global libraries enabling new models and scenarios to be developed in hours, not weeks.
This creates a rich dataset of operating, reliability and cost metrics enabling deep analysis of entity, value chain and asset performance

ManagedAnalytics ingests data from your existing systems, either periodically or in real-time, ensuring data is relevant and up to date.
The model applies the data into the structured logic of the model and continuously uses the data to update calculations and correlations.
ManagedAnlytics helps overcome key challenges facing frontline mine management teams
Increasing System and Data Complexity
Systems and IoT devices are driving an exponential increase in volumes of data collection.
Lack of True Operational Decision Support
Frontline manager are overwhelmed with data & reports, but lack actionable insights integrated into operational processes.
Optimisation Solutions are Complex & Fragmented
Existing optimisation solutions are overly technical, encourage silo optimisation and rely on specialist tools and skillsets that are expensive and difficult to source and retain.
Complex Spreadsheets for Reporting/Analysis
In a sea of data and systems, most mines use spreadsheets to run their reporting and operations. These are usually complex, time-consuming and often inaccurate documents.
Key Features
Visual Operational Modelling
Intuitive Interface: Build digital models of complex value chains with a simple, drag-and-drop interface.
Customisable Objects: Import standard industry equipment from a global library or create custom objects tailored to your operations.
Data ingestion: Ingest data from your existing systems source using a range of integration connectors.
Metric Integration: Add, delete, or modify operational, cost, revenue, safety, and personnel metrics at any level.
Improvement Initiatives & Outcome Quantification
Scenario Development: Create multiple improvement scenarios with varying operating configurations and assumptions.
Financial Impact Assessment: Quantify the effects of productivity changes on key financial metrics such as Revenue, EBIT, and free cash flows.
Visualisation Tools: Use frontier charts to identify optimal configurations and assess the impact of macroeconomic factors like unit cost, pricing, and foreign exchange on profitability.
Analysis and Opportunity Identification
Constraints Modelling: Identify bottlenecks and performance constraints across complex value chains.
Predictive Analysis: Leverage machine learning models to analyse data and proactively identify variances and trends.
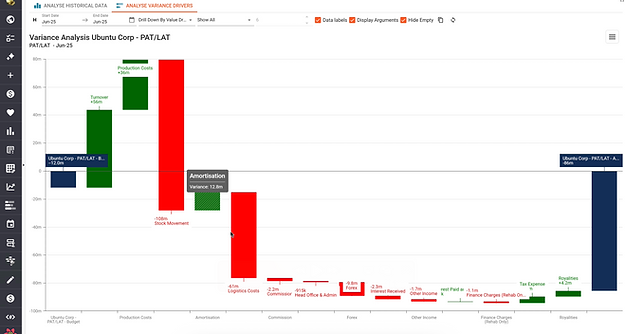
Advanced Analytics: Utilise sensitivity analysis, time series analysis, source-of-variance analysis to uncover key drivers affecting operations.
Portfolio Management of Improvement Initiatives
Integrated Change Management: Create and oversee improvement initiatives with defined project gates and approval workflows.
Progress Tracking: Monitor progress against detailed action plans and measure performance against specified operational and financial metrics.
Portfolio Oversight: Manage multiple improvement portfolios, tracking the cumulative impact on costs, operational enhancements, and bottom-line results.
Reporting and Dashboards
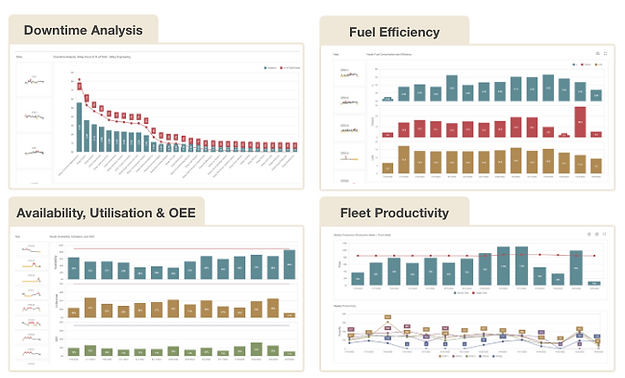
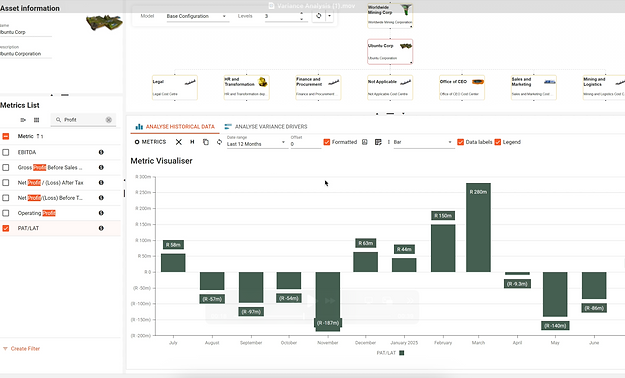
ManagedAnalytics provides a suite of analytics and visualization tools that enable frontline management and data science teams to interact with data intuitively, without the need for complex data pipelines or coding. The platform's open architecture allows for easy integration with existing BI platforms, leveraging current investments.
Simulation & Scenario Modelling
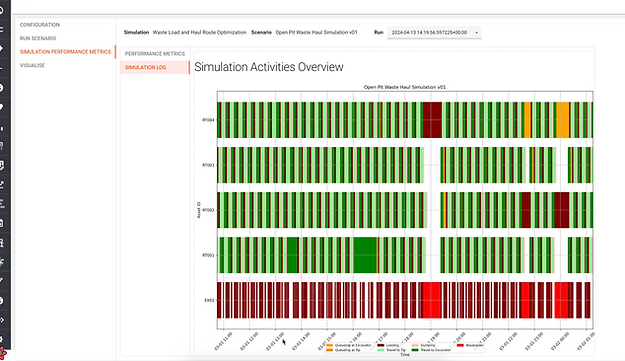
The platform enables the development of discrete event simulations to optimize operations such as Load and Haul fleets. Users can test potential changes without disrupting operations, facilitating proactive decision-making.
Optimisation & Constraints Analysis
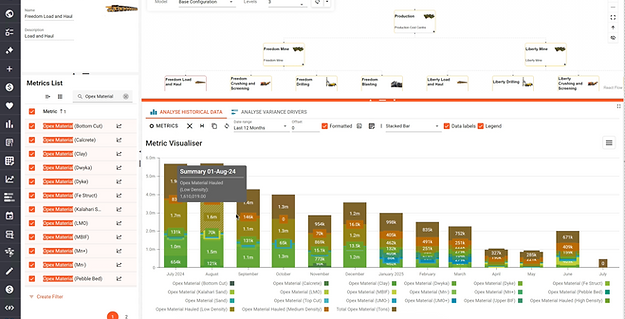
ManagedAnalytics includes optimisation tools specific to the mining industry, allowing for value chain modelling and constraints modelling to identify bottlenecks. These tools support the development of improvement scenarios and the identification of root causes of performance gaps.
Decarbonisation Tools
Track carbon emissions such as diesel consumption, power usage and travel right down to the asset level. Generate Marginal Abatement Cost Curve (MACC) reports to assist with decision making.
AI Integration
ManagedAnalytics uses AI to enable natural language queries so that any user can generate detailed reports without the need for code. Coupled with this, the platform integrates machine learning models for anomaly detection on key metrics, providing frontline management with alerts on variances to operating thresholds and emerging equipment issues. This proactive approach supports operational decision-making and enhances equipment reliability.
Architecture & Security
The platform ingests data from existing systems, either periodically or in real-time, ensuring data is relevant and up to date.
It applies this data into the structured logic of the model, continuously updating calculations and correlations.
ManagedAnalytics allows granular security controls to ensure that users can be given the right level of access to the data that they need to effectively complete their tasks without compromising security and confidentiality.
What this enables
Consolidation & Collaboration
Cross functional teams share common data & business logic
Integration
Integrated financial and operations view of the end-to-end value chain.
Security and Auditability
Controlled, audited access
to data. Give staff the access they need, and no more.
End-to-End Value Chain Optimisation
Consolidated view of overall mine performance, with visibility of how each link in the value chain is performing.
